Engineering Statistics Project
ANALYSIS
The Meaning of Your Morning Munchies
The team aimed to design an experiment and collect data to determine the loudest cereal and milk combination. In order to bring meaning form the data madness, we utilized statistical analysis tools such as ANOVA, t-tests, power analysis, DOE means plots, factor-level interaction plots, and more. Statistical analysis tools informed us of statistically significant relationships between cereals, type of milk, and/or volume of milk, as well as how many trials would be necessary to improve our current insignificant data. Design of Experiment (DOE) analysis illustrated the effects of each variable in comparison to other controllable variables. The team plotted the response variables against possible causes of outcomes. We ensured response variables were not correlated to trial number or time and identified the most important factor through a DOE means plot and the most significant factor level through both response variable vs factor level plots and interaction plots. The following sections detail and interpret the data to discover the optimum cereal combination for the loudest bowl of cereal.
GOALS OF ANALYSIS
-
Determine statistical significance of cereal, type of milk, and volume of milk, if any using ANOVA and t-tests
-
Determine trial size required to determine statistical significance through power analysis
-
Visualize impact of factors and factor levels on response variables with DOE means plots and response variable vs. factor level graphs
-
Observe factor level combinations with greatest impact on initial and sustained sound level with interaction plots to determine the optimal conditions for the loudest bowl of cereal
STATISTICAL ANALYSIS
ISAIAH BRYNER
Introduction:
The type of analysis introduced in this section is known as statistical analysis. It will utilize our numerical data (Tables 5 & 6) through a combination of tests that indicate whether our experiment yielded significant results. These tests include single factor ANOVA, t-tests, power analysis, and confidence intervals. In this case, statistical analysis is used to determine which combinations of cereal, milk, and volume of milk cereal created statistically different sounds.
Methods:
First, an ANOVA test of our data was conducted (with a sample size of 36) using the Excel data analysis package (shown in Tables 7 & 8). Then p-values of 5.99E-19 after 15 seconds and 7.54E-18 after 90 seconds were determined from the ANOVA, which are much less than our level of significance determinant of 0.05. This means that at least one of the means between each trial run is significantly different.
Now that this was determined, follow-up 2-tailed t-tests between each cereal-milk-volume combination were conducted (Equation 2). A display of resulting t-tests are shown in Tables 9 and 10. If the p-value between two combinations were below our level of significance value of 0.05, then it was concluded that those two combinations had significantly different results from which we could draw conclusions.
A power analysis using an online sample size power analysis calculator (with β=0.8) was then conducted in order to determine the sample size needed between each combination that did not yield significantly different results (Tables 11 & 12). The online sample size calculator we used was by DSS Research and it required an input of the average and standard deviation of each sample as well as the alpha error level and statistical power. Therefore, the power analysis allowed us to determine the sample size that would be needed for these combinations to have made a significant difference.
95% confidence intervals were then calculated for each combination mean. This gives a range in which we can be 95% certain that the populated mean falls within. The confidence intervals were determined by the 2-tailed inverse of the t-distribution, which was then used to find our SEM and swing terms for our intervals (Equation 3).
Results:
From our calculations, we were able to visually represent the results that our analysis yielded. Shown below are the results of our analysis that we interpreted and from which we gathered conclusions. The methods to gather these results such as single factor ANOVA test, two-tailed t-tests, power analysis, and confidence intervals were explained above.
As shown by Figure 15 and 16, the mean sound level for each cereal-milk-volume combination (both for the first 15 seconds and then for 90 seconds) were compared. Figures 17 and 18 display the significant differences between each type of cereal. Every type of cereal was significantly different with each other since every p-value was very far below 0.05, both for initial loudness as well as sustained. The biggest difference occurred between Rice Krispies and Cookie Crisp as determined by interpreting the p-values of 3.50E-12 after 15 seconds and 7.49E-17 after 90 seconds (the smaller the p-value, the more significantly different the two cereals were in their sound level results). The smallest difference in p-value occurred between Cheerios and Cookie Crisp as determined by interpreting the p-values of 3.15E-10 after 15 seconds and 6.41E-12 after 90 seconds.
The two types of milk were also compared in Figures 19 and 20 for which we got p-values of 0.122 after 15 seconds and 0.0492 after 90 seconds. This indicates that there was not a significant difference between the two milks initially, but as time went on, slight significance occurred.
Lastly, Figures 21 and 22 display the differences in the volumes of milk. As the data shows, the volume had extremely little impact on the sound level of the cereal, with p-values of 0.478 after 15 seconds and 0.390 after 90 seconds.
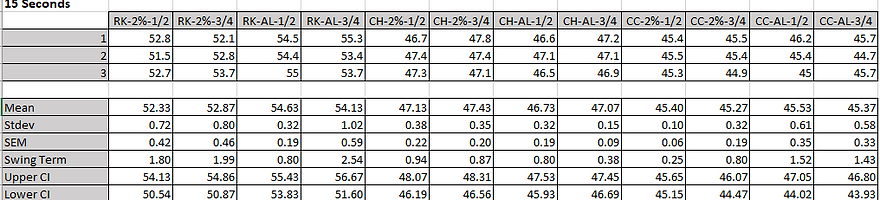

Table 5: Table of data for the initial sound level within 15 seconds, each column being a cereal-milk-volume trial run combination.
Table 6: Table of data for the sustained sound level within 90 seconds, each column being a cereal-milk-volume trial run combination.

RK = Rice Krispies Ex. RK-2%-1/2 = Rice Krispies with 1/2 cup of 2% milk
CH = Cheerios
CC = Cookie Crisp
2% = 2% milk
AL = Almond milk
1/2 = 1/2 cup of milk
3/4 = 3/4 cup of milk
Equation 2: Equation for the t-statistic from which the p-value is determined.
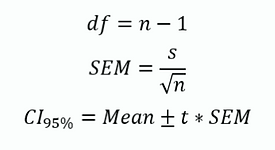
Equation 3: Equations for degrees of freedom, standard error of the mean, and the 95% confidence interval.
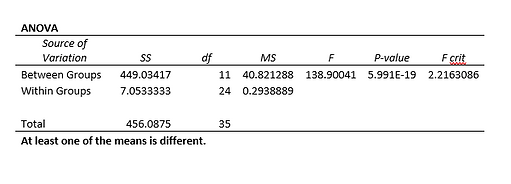
Table 7: Initial sound level single factor ANOVA test generated by Excel's data analysis package.
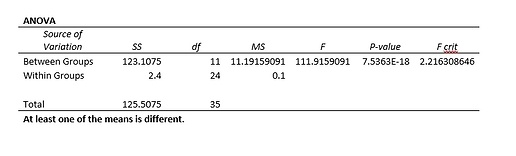
Table 8: Sustained sound level single factor ANOVA test generated by Excel's data analysis package.

Table 9: Initial sound level p-values between each trial run combination with values above 0.05 (level of significance value) in green, indicating significant difference.
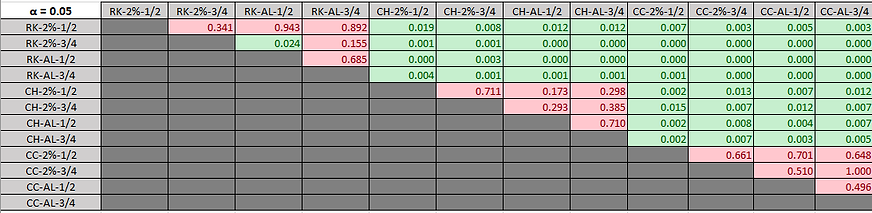
Table 10: Sustained sound level p-values between each trial run combination with values above 0.05 (level of significance value) in green, indicating significant difference.
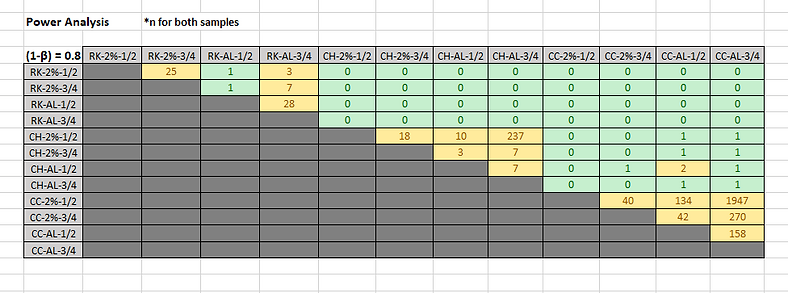
Table 11: Initial sound level power analysis table with combinations needing more sample sizes indicated by yellow.

Table 12: Sustained sound level power analysis table with combinations needing more sample sizes indicated by yellow.

Figure 15: Initial sound levels of the trial combinations shown generally for average decibel comparison.

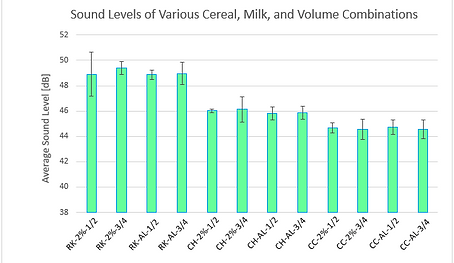
Figure 16: Sustained sound levels of the trial combinations shown generally for average decibel comparison.

Figure 17: Initial sound level representation of significant difference analysis between the three types of cereal and their means.

Figure 18: Sustained sound level representation of significant difference analysis between the three types of cereal and their means.
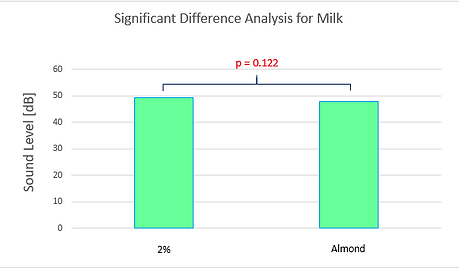
Figure 19: Initial sound level representation of significant difference analysis between the two types of milk and their means.
Figure 20: Sustained sound level representation of significant difference analysis between the two types of milk and their means.
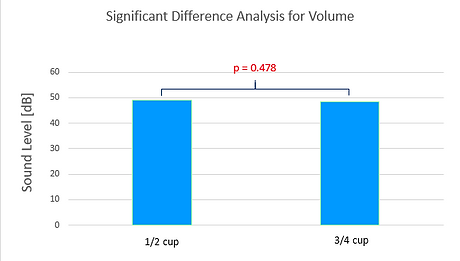
Figure 21: Initial sound level representation of significant difference analysis between the two types of volume and their means.
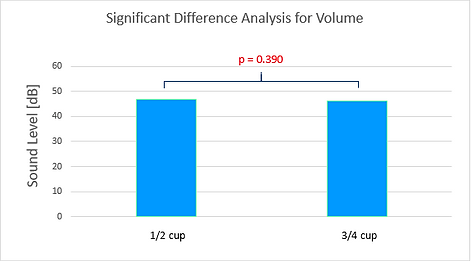
Figure 22: Sustained sound level representation of significant difference analysis between the two types of volume and their means.
Conclusions:
From this analysis of our data we were able to reach some valuable conclusions. According to our results, Rice Krispies had a wide range of sound level difference from the other two cereals, making it the dominant cereal in initial sound level as well as sustained sound level. Cheerios and Cookie Crisp had almost indistinguishable differences in sound according to our observations during testing. So, it was a bit surprising when these two cereals had a p-value between them that was so much lower than 0.05, indicating that they were very significantly different in sound level (both initially and sustained). Therefore, Rice Krispies were much louder than the other cereals whereas the other two were closer because they were quiet, but still had a significant difference with Cheerios being the second loudest and Cookie Crisp being the quietest (initially and sustained). The differences between the milks were interesting. Our results state that initially (first 15 seconds) the type of milk was not significantly different in sound level. However, as the time was sustained (90 seconds), the type of milk became progressively more significant to the point where it met our determined significance level. Therefore, we can conclude that the sound level is affected by the type of milk but only over a longer period of time. The volume of the milk was not significantly different at all, neither initially nor sustained. This means that the sound level does not really depend on how much milk is used (at least within our time frame).
Our statistically analyzed results could possibly be enhanced by having more trials to deal with, giving us more accurate results as we increase sample size, or even decreasing our level of significance would help as well. The only weakness detected in our analysis would be analyzing each component of the trials separately without it being influenced in some way by the other components (cereal, milk, volume). In conclusion, our hypothesis was both rejected and accepted as a result of this analysis. We hypothesized that the type of cereal, type of milk, and volume of milk would all affect the sound level of the cereal. This is partially accepted because the type of cereal and type of milk will affect the sound level because of their significant differences from our results, however the volume of milk does not matter when determining the sound level of the cereal.
DOE DATA ANALYSIS
Meghan Sampson
Introduction
Design of Experiment (DOE) analysis provides visual comparisons between factors, factor levels, and the combinations of factors to interpret data beyond ambiguous numbers. Through this data analysis, we aim to observe the factor with the greatest effect on each response variable, initial sound level and sustained sound level. Plots of response variables vs. trial number, response variables vs. time, and response variables vs. factor levels will be generated to allow observation of variables affecting the outcome. DOE means plots will present a summary of the average response variable from each factor level, while interaction plots will reveal the factor level combinations with the greatest effect on response variables.
Methods
To begin our DOE analysis, we created a plot of response variables vs. trial number. The average response variable of each trial was plotted against its trial number to provide an overall view of the general trend in the data. The standard deviation of each trial’s response is incorporated into the data points via error bars. The standard deviation was calculated from the trial replications using Excel. The response variables were also plotted against the time their trial run began. These distributions simply demonstrate the possible trends in the data due to time or order of procedure that may have an influence on the response variables.
Next, we manipulated and organized the raw data to directly compare the effects of each factor level on response variables. This was done by averaging the response variable resulting from one constant controllable variable and using the standard deviation between its data points to create error bars of plus or minus one standard deviation. The graphs allow us to directly compare the effect of each factor level on the response variable.
DOE means plots for each response variable were designed in respective graphs to determine the most influential factor level. This plot was developed in a similar way to the previously mentioned factor level graphs; each data point is an average response variable of the trials controlling for one specific variable. Data points of a factor’s levels are connected to establish relationships and highlight effects. Factors with the steepest slope are the most important factors, while factors with low slopes are less important in their impact on the response variable.
Additional interaction plots demonstrate the relationship between two controllable factors and their effect on the initial or sustained sound levels of the bowl of cereal. These plots were generated by creating a chart averaging the response variables resulting from two constant variables. Then one factor level is plotted against the levels of another variable. These line graphs are useful for comparing the overall contributor to sound level as well as distinguishing the factor level change that causes the greatest variation in sound level. Lines with steep slopes would indicate the levels of that factor are the greatest contributor to changes in the response variable.
Results
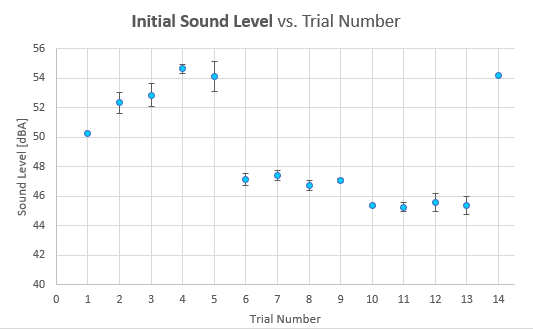
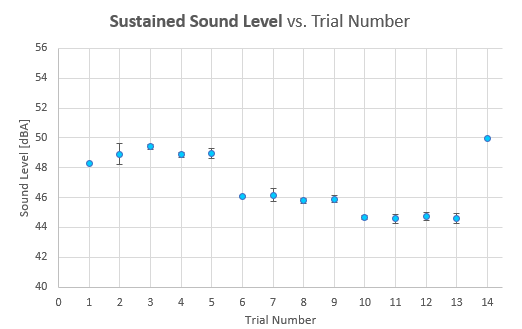
The first two graphs featured below display a response distribution plot of the average of each replicated trial. Figure 23 displays the response distribution of the initial sound level from the first 15 seconds of each bowl of cereal over 14 trials, including baseline tests. Figure 24 displays a similar response distribution for the sustained sound level from 0 to 90 seconds of a bowl of cereal across 14 trials. These two graphs show the effect of the trial number on the sound level recorded. Data points at Trials 1 and 14 were baseline tests, so they should be a similar height on the graph to represent consistency and reliability across all trials. The error bars show the spread of the data with standard deviation across the three replications of each trial. The data points at the baseline trials do not have error bars because one test was conducted per baseline.
figure
figure
Figure 23: Effect of trial number on sound level over first fifteen seconds
Figure 24: Effect of trial number on sound level over first ninety seconds
The next two graphs display the response distribution of the initial sound level and sustained sound level over time in Figures 25 and 26 respectively. From these graphs we concluded that the time and order of data collection did not have an undesired effect on our overall data. The response variables maintained expected outcomes despite time continuing and order of data collection.
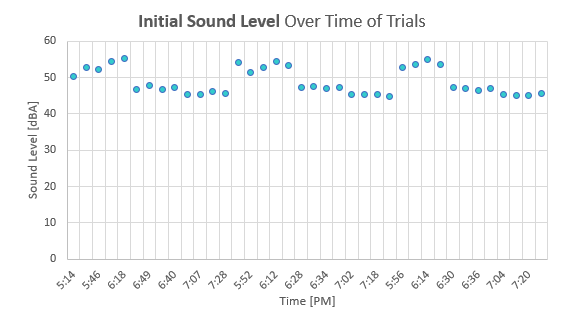
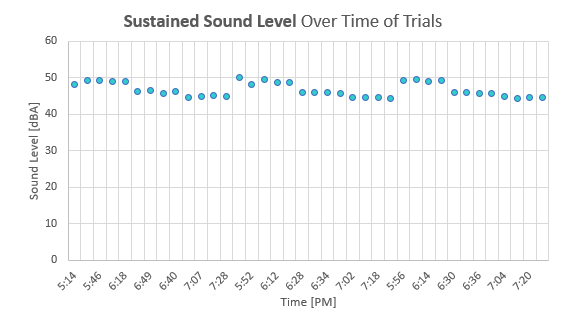
Figure 25: Effect of time trial was conducted on sound level over first fifteen seconds
Figure 26: Effect of time trial was conducted on sound level over first ninety seconds
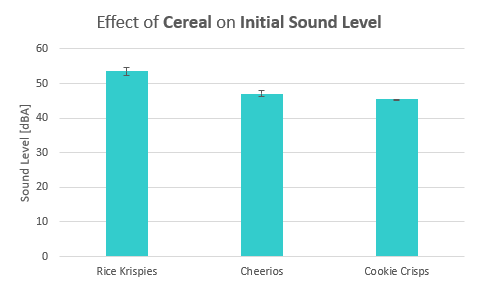
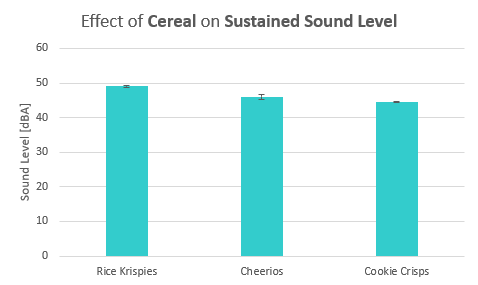
To visualize the effect of each controllable factor and its levels on the response variables, we graphed the levels of each factor together in a bar graph. Each bar graph qualifies the response variable as a result of a single variable by averaging the outcomes of that variable. They also include an error bar to represent the standard deviation of each response variable resulting from each variable.
Figure 27 shows the effect of the three cereals, Rice Krispies, Cheerios, and Cookie Crisps, on the initial sound level of the bowl of cereal. From this graph, we can easily conclude that Rice Krispies were the cause of the greatest initial sound level, followed by Cheerios and Cookie Crisps. In Figure 28, we see that Rice Krispies still cause the greatest sustained sound level as well.
Figure 29 compares the initial sound level resulting from 2% milk and almond milk, in which almond milk proves to have a slightly higher initial sound level. The overlap in error bars do not allow allow us to draw a decisive conclusion. Comparing the sustained sound level as a result of each type of milk does not produce any visible differences, as seen in Figure 30.
Finally, we compared the effects of just the volume of milk on the initial sound levels. In Figures 31 and 32, we cannot see a definitive greater response variable, implying that the volume of milk added to a bowl of cereal does not affect its initial or sustained sound level alone.
Figures 27-32: Response variable vs. factor levels with error bars representing standard deviation

The data was further organized into a DOE means plot for each response variable to compare average sound levels of each controllable variable in one plot. The plot for sound level over the first 15 seconds in Figure 33 shows that cereal is the most important factor with the greatest slope between factor levels. Type of milk is the second most important factor followed by the factor with the least steep slope, the volume of milk. Of the three cereals, Rice Krispies produce the greatest average sound level.
The second DOE means plot in Figure 34 shows that all variables have a lower average sound level compared to the first DOE means plot over a greater amount of time, but Rice Krispies still produce the most significant amount of sound compared to its counterparts. The type of cereal is again the most important factor. The type of milk and volume of milk are equally less important to the shange in response variable in comparison to cereal.


Figure 33: Average initial sound level of each factor level compared by factor
Figure 34: Average sustained sound level of each factor level compared by factor
The final group of graphs shows interactions between combinations of factors’ levels. Figure 35 displays the effect of types of milk and types of cereal on the initial sound level. Once again, Rice Krispies produce the overall greatest sound level, no matter what kind of milk the cereal is placed in; almond milk causes an increase in the sound of Rice Krispies while decreasing the sound of Cheerios. Interestingly, the type of milk has little effect on the sustained sound level of cereals, as the relatively flat lines in Figure 36 suggest. Still, Rice Krispies top the sound levels of Cheerios and Cookie Crisps.
It seems that the volume of milk has little effect on the initial sound level, based on the interactions in Figure 37, while the type of cereal maintains the previous hierarchies. A similar trend continues in the sustained sound level based on milk volume and type of cereal, as seen in Figure 38.
Milk volume does not have a visible effect on the sound level while the type of cereal does. Milk volume also has very little effect on initial sound level, as seen in Figure 39, though almond milk does have a slightly higher initial sound level overall. Milk volume and type of milk also has little effect on the sustained sound level. In fact, they have nearly the same average effect on sound level with nearly equal response variables, seen in Figure 40.
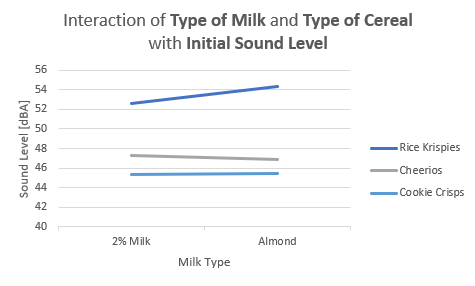
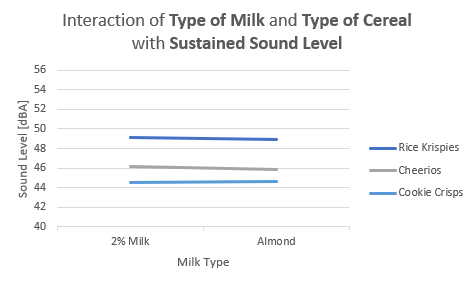
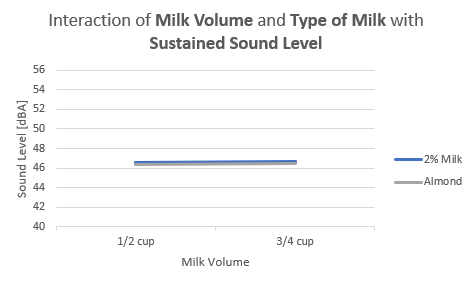
Figure 35-36: Interaction between type of milk and type of cereal factor levels and their effect on initial and sustainable sound level, respectively
Figure 37-38: Interaction between volume of milk and type of cereal factor levels and their effect on initial and sustainable sound level, respectively
Figure 39-40: Interaction between volume of milk and type of milk factor levels and their effect on initial and sustainable sound level, respectively
Conclusions
Our DOE analysis revealed that cereal held the greatest influence on both initial and sustainable sound level in comparison to type of milk and volume of milk factors.The DOE means plot and interaction plots for each response variable proved this. Our factor level charts, in conjunction with DOE means plots, specified that Rice Krispies produced the greatest sound level overall, and interaction plots proved this to be the case for all combinations of factor levels. Type of milk has a lesser impact on the response variables, and volume of milk has an even smaller impact based on factor level graphs. According to our interaction plots, the optimum combination for highest initial sound level is Rice Krispies in any volume of almond milk, while the best combination for highest sustainable sound level is Rice Krispies with any volume of 2% milk.